
Salaries have benchmarks. Equity is harder to compare. Explore how 9,000+ verified new-hire grants vary by department, seniority, and company stage.
Select the cohort most relevant to you.

Compare verified equity grants across roles, seniority levels, departments, and company stages. See how the first grant employees received when joining a startup compares to similar grants in Equitybee’s dataset.
The benchmark is built from verified new-hire equity grants submitted through Equitybee. It provides market context based on Equitybee's dataset and is intended for informational purposes only. The dataset has not been independently verified, and should not be interpreted as representative of grants that ultimately led to successful liquidity events. Data presented as is. Data last updated July 2026.
See how your startup offer compares to verified new-hire grants for similar roles, seniority levels, and company stages.
See what employees typically receive when hired into the role you're moving into, or the role you already hold.
See what similar employees receive when joining the companies you may consider next.
In Equitybee's dataset, the median new-hire equity grant was approximately $59K in 2025, up from $18K in 2019. The shift hasn't been even across industries, departments, seniority levels, or company stages. Here are three findings from the data.
Median grants climb from $15.2K for Individual Contributors (ICs) to $215K at the VP & C-Level.
AI & Data rose from 14.6% of grant activity in 2023 to 19.7% since 2024, with median grants up from $57.9K to $72.6K.
Individual Contributors (ICs) medians range from $11K in Operations to $23.2K in Engineering, about a 2× spread.
Figures reflect median new-hire Grant FMV in Equitybee's dataset. Data presented as is.
In Equitybee's dataset, median New-Hire Grant FMV rose from approximately $18K in 2019 to $57K in 2022.
Grant values declined in 2023, but did not return to earlier levels. The median remained close to $60K in both 2024 and 2025.
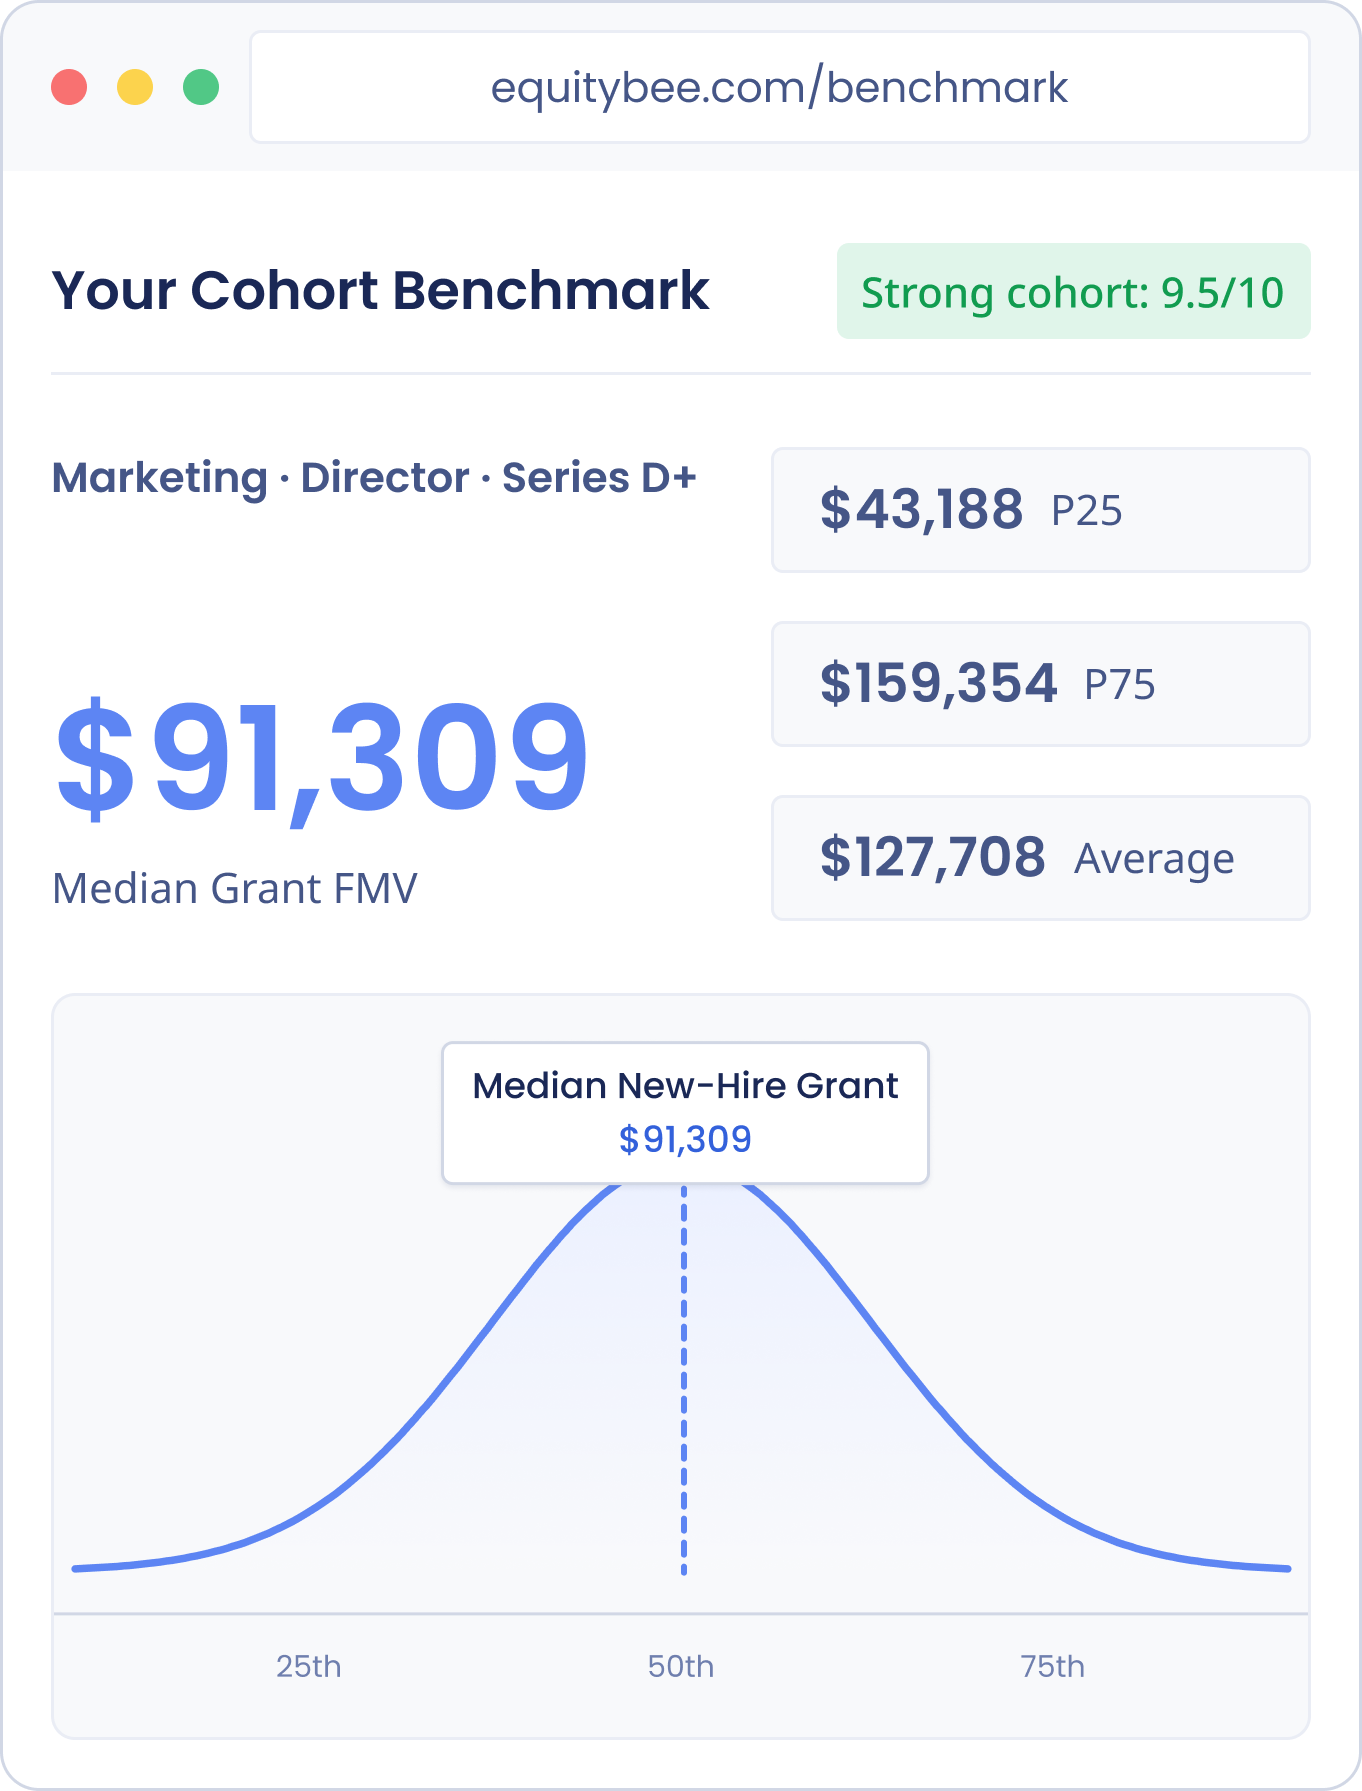
Create a free account to see the full distribution for a specific cohort, and how the result changes when you adjust one factor at a time.
Among ICs, Engineering’s median new-hire grant FMV is $23.2K, compared with $14K for Marketing, a 67% difference.
At VP and C-level, the medians are nearly identical at $228.5K and $229.2K.
This comparison combines all company stages. Build a cohort to explore a specific combination of department, seniority, and company stage.
Bars are scaled within each seniority level. Figures reflect median New-Hire Grant FMV across records with the relevant department and seniority fields available. Data presented as is.
Grant values can vary meaningfully based on the type of company and where it is in its growth journey.
From 2024 through 2026 YTD, several highly technical industries show elevated median new-hire Grant FMV in Equitybee's dataset. AI & Data companies benchmark above the median for all other industries, but Deep Tech and Cybersecurity show that higher recent grant values are not limited to AI.
Median new-hire Grant FMV rises across company stages in Equitybee's dataset, largely because FMV per share grows as companies mature. The median Series D+ New-Hire grant is approximately 3.1× the median Seed / Series A grant in grant-date FMV terms.
A higher grant-date FMV does not mean a more valuable outcome. Earlier-stage grants typically carry lower FMV and strike prices, which can mean lower exercise costs, alongside higher risk and longer liquidity timelines. That is why the Benchmark compares grants within the same company stage. Recent industry data includes 2024, 2025, and 2026 YTD. Figures use records with the relevant fields available. Data presented as is.
Option count alone does not tell you how one startup stock option grant compares with another. The same number of options can represent very different values across companies.
The Equitybee Benchmark compares grants using Fair Market Value at the time the grant was issued.
For most option grants, the FMV at grant is equal to the strike price. Each record represents a New-Hire equity grant: the first equity grant an employee received when joining a company. This provides a more consistent comparison point across departments, seniority levels, and company stages.
*For most option grants, the FMV at grant is equal to the strike price. Comparing FMV at grant creates a consistent basis across companies with different share prices and option counts.
The benchmark is built from verified equity grants employees received when joining startup companies.
Individual Contributors (ICs) - 28.10%
Senior ICs & Team Leads - 35.28%
Senior Managers & Directors - 20.93%
VPs & C-Level Executives - 14.55%
Founders & CEOs - 1.15%
Verified Grants
Companies
Seed / Series A - 24.06%
Series B - 21.54%
Series C - 20.94%
Series D+ - 33.45%
Explore new-hire grant benchmarks across 5 seniority levels, 7 departments, and 4 company stages.
The dataset reflects new-hire equity grants. It does not directly benchmark promotion grants, refresh grants, or the current value of an employee's total equity package.
Because the data reflects Equitybee's user base, it represents a sample of the startup market rather than a complete view of all startup equity grants. Some departments, industries, company stages, and seniority levels are represented more heavily than others.
Cohort strength and contexts are displayed throughout the full Benchmark to help users interpret each result.
*Equitybee benchmark dataset is proprietary information. The dataset is derived exclusively from Equitybee's platform data. The Benchmark methodology and dataset have not been independently verified. Data presented as is.
Frequently asked questions
A startup equity benchmark helps employees compare equity grants across similar departments, seniority levels, and company stages. The Equitybee Benchmark is built from new-hire equity grants submitted through Equitybee.
A new-hire equity grant is the first equity grant an employee receives when joining a company. For startup employees, this is often a stock option grant.
In Equitybee's dataset of 9,000+ verified new-hire grants, the median new-hire grant FMV was approximately $59K in 2025 and $65K in 2026 year-to-date. Values vary widely: median grants range from roughly $20K at Seed / Series A companies to $62K at Series D+, and from about $15.2K for ICs to $215K at the VP & C-Level.
There is no single right amount. Equity depends on role, seniority, company stage, industry, and the salary trade-offs in the offer. Startup equity is often discussed as an ownership percentage, but percentages are difficult to compare across companies with different share counts and valuations. The Equitybee Benchmark approaches the question through grant value, Options Granted × FMV per Share at Grant, so you can compare a specific offer with verified new-hire grants from a similar cohort.
In Equitybee's dataset, AI & Data companies show a median new-hire grant FMV of approximately $73K from 2024 through 2026 YTD, compared with a $52K median across all other industries. Higher recent grant values are not limited to AI: Aerospace, Defense & Deep Tech ($89K) and Cybersecurity & Security ($72K) also benchmark above that level.
In Equitybee's dataset, median new-hire grant FMV rose from about $12K in 2016 to approximately $59K in 2025, peaking during the 2021-2022 funding boom. Values declined in 2023 but did not return to earlier levels; the median has remained near $60K since 2024.
In Equitybee's dataset, the median new-hire grant FMV at Series B companies is approximately $29K, compared with $20K at Seed / Series A and $62K at Series D+. Whether a specific offer is competitive depends on department, seniority, salary, and the rest of the compensation package; the full Benchmark shows the distribution for a specific cohort.
Not necessarily. FMV at grant reflects the company's share value when the employee joins, so later-stage grants naturally show higher grant-date values and typically higher exercise costs. Earlier-stage grants carry lower strike prices with more risk and a wider range of possible outcomes. The Benchmark is designed to compare grants within a similar company stage, not to judge one stage against another.
It depends on seniority. Among ICs in Equitybee’s dataset, the median FMV of a new-hire grant is $23.2K in Engineering, compared with $14K in Marketing, a 66% difference. At the VP and C-suite level, however, that gap effectively disappears. The medians are $228.5K for Engineering and $229.2K for Marketing, with Marketing just ~0.4% higher.
Tools like Levels.fyi rely largely on self-reported total compensation data, and Carta's benchmarks are built from company-side cap table records. The Equitybee Benchmark is built from new-hire equity grants submitted through Equitybee by employees, focuses specifically on startup equity rather than total compensation, and compares grants using FMV at grant. Each source has a different scope, and they can be complementary.
Consider the number of options, FMV or strike price at grant, company stage, department, seniority level, salary, and other compensation terms. The Equitybee Benchmark compares grants using Options Granted × FMV per Share at Grant.
Grant Value is calculated by multiplying the number of options by the Fair Market Value (FMV) per share on the grant date. It provides a dollar-based measure for comparing grants when they were issued and does not represent their current or potential future value.
Grant FMV is the number of options multiplied by the company’s fair market value per share on the grant date. For private companies, FMV is generally based on an independent third-party valuation using established methodologies.We believe it provide a more consistent dollar-based basis for comparing joining grants across companies.
No. The Benchmark is built from new-hire equity grants. It may still provide useful directional context for promotion, refresh, or internal equity conversations, but those grants can be structured differently.
Yes. You can compare the first equity grant you received when you joined the company. You can also use the data as directional context for what employees receive when hired into the role you already hold.
The Benchmark is derived exclusively from Equitybee's platform data and is based on equity grant information submitted through Equitybee. The dataset has not been independently verified and may not represent the full startup market.
Salary benchmarks focus on cash compensation and often rely on survey responses. The Equitybee Benchmark focuses specifically on startup equity and is built from employee grant information submitted through Equitybee.
Yes. The Benchmark is free to use. An account is required to access detailed cohort results.
No. The Equitybee Benchmark is provided for informational purposes only and should be used as market context, not as financial, tax, legal, or compensation advice.
Salaries have benchmarks. Equity is harder to compare. Explore how 9,000+ verified new-hire grants vary by department, seniority, and company stage.
Median, percentiles & average
Sample size for every result
Change one factor at a time
Free to use. Built from 9,000+ verified new-hire equity grants.
Select the cohort most relevant to you.
The benchmark is built from verified new-hire equity grants submitted through Equitybee. It provides market context based on Equitybee's dataset and is intended for informational purposes only. The dataset has not been independently verified, and should not be interpreted as representative of grants that ultimately led to successful liquidity events. Data presented as is. Data last updated July 2026.